
Introduction
SEO Data Overload and Reporting Challenges
Modern search programs rely on dozens of disconnected data sources. A typical team might check Google Analytics for traffic, Search Console for queries, Semrush or Ahrefs for rankings, and LinkedIn or X for content engagement. Each platform uses different metrics and time frames, so simply answering, “Did organic performance improve this month?” becomes a manual puzzle.
When reports are stitched together in spreadsheets, the risk of copy‑paste errors and broken formulas grows. Agencies sending monthly PDFs to 20 clients often spend entire days just cleaning numbers. Stakeholders at brands like HubSpot or Shopify expect clean trend lines, not messy tabs and one-off screenshots, so inconsistent reporting quickly erodes trust.
How Automated Reporting Tools Solve the Problem
Reporting platforms pull data from analytics suites, search tools, and social channels into unified dashboards. For instance, a Looker Studio setup can blend Google Analytics sessions, Search Console impressions, and Ahrefs keyword data in one view, letting teams evaluate performance by URL, topic cluster, or funnel stage without constant exports.
These systems also schedule recurring email summaries, such as a first‑Monday organic performance report for every account manager. Visualizations like time‑series charts and KPI scorecards replace raw CSVs, so clients see clear trends in clicks, conversions, and revenue impact rather than decoding pivot tables.
What to Expect from This Guide
This Keywordly guide focuses on tools built specifically to automate SEO reporting, not broad content platforms or generic BI software. You will see how different roles use them: a solo consultant tracking 15 local sites, an in‑house lead at a B2B SaaS brand, or an agency director overseeing 60+ retainers.
We’ll walk through 10 widely used solutions, outlining strengths, weaknesses, pricing ranges, and typical user feedback from sources like G2. For each, you’ll get ideal use cases—for example, white‑label client portals versus deep technical dashboards—so you can assemble a reporting stack that matches your budget and workflow instead of forcing a one‑size‑fits‑all approach.
Understanding Automated SEO Reporting & Analytics
What Are Automated Reporting Tools & SEO Reporting Software?
Automated reporting platforms pull data from sources like Google Search Console, GA4, and Ahrefs, then turn it into scheduled dashboards. Instead of exporting CSVs every week, you can trigger a Monday email with visuals your team actually reads.
Tools such as Whatagraph, highlighted in 6 Best SEO Reporting Tools & Software for Agencies in 2025, let agencies auto-generate cross-channel reports so account managers spend time on insights, not spreadsheets.
Search-focused reporting software narrows in on rank tracking, organic sessions, crawl errors, backlinks, and content performance. A consultant might connect Semrush for keyword movements, Screaming Frog exports for technical issues, and Keywordly dashboards to show impact by URL cluster.
That combined view makes it obvious when a canonical fix or internal link update pushed key terms from page two to the top three, tying technical work directly to revenue pages.
Broader marketing analytics suites layer SEO alongside PPC, social, and email, ideal for brands running integrated campaigns. An eCommerce retailer, for example, can see how a Black Friday blog hub supports Google Ads remarketing and Klaviyo flows in the same funnel report.
Content optimization tools then go deeper at the page level, benchmarking your articles against competitors for depth, search intent, and on-page structure. Platforms like Clearscope and Surfer compare headings, entities, and readability so your writers know exactly what to improve before publishing.
Who Needs These Tools?
Specialists, agencies, and marketing leaders all rely on automated insights, but their use cases differ. Clear alignment on who reads the report—and how often—prevents bloated dashboards no one opens.
Keywordly clients often start with one audience, such as executives, then add deeper, analyst-only views once the core ROI story is established.
Consultants and in-house SEOs use recurring reports to prove traction over quarters, not days. A B2B SaaS strategist, for instance, might track weekly ranking trends, monthly organic trials, and quarterly technical health scores to justify migration work or new content clusters.
Because reports are automated, they can quickly isolate drops caused by algorithm updates versus site changes, which is critical during leadership reviews.
Content marketers need visibility into how individual posts and landing pages drive engagement and assisted conversions. A blog lead at HubSpot-style scale may tag every article by topic and funnel stage, then watch which clusters influence demo requests, not just pageviews.
Agencies managing dozens of accounts lean on white-label templates to deliver on strict reporting deadlines. Platforms like Whatagraph, named in the SEO reporting tools for agencies roundup, help them standardize structure while customizing logos and commentary per client.
Finally, growth leaders and CMOs use analytics suites to align stakeholders around a shared set of KPIs—often organic pipeline, not just traffic. When executives can skim a single dashboard that connects rankings to SQLs and revenue, budget conversations for content and technical work at Keywordly become far easier.
This shared visibility keeps product, sales, and marketing rowing in the same direction, especially when quarterly targets depend heavily on search performance.
Semrush
Overview
Semrush is a cloud-based marketing suite that helps teams manage SEO, PPC, and content performance from one dashboard. For Keywordly clients, it often becomes the core dataset driving keyword decisions, technical fixes, and competitive research across multiple domains.
Agencies use it to track rankings, audit sites, and benchmark against rivals like HubSpot or Shopify in specific niches. Its reporting layer can combine platform data with Google Analytics and Search Console, giving stakeholders a single, shareable view of organic and paid performance.
Technical Requirements
Because the platform runs in a browser, most Keywordly partners only need a modern Chrome or Firefox setup and reliable broadband. There is no desktop software to maintain, which makes onboarding remote teams and clients much easier.
To unlock richer reporting, connect properties from Google Analytics, Search Console, and sometimes social profiles like Facebook Pages. Agencies handling large franchises or multi-country sites often opt for higher tiers so they can manage more projects and export bigger data sets via CSV or API.
Competitive Positioning
Within the SEO stack, Semrush is often compared with Ahrefs and Moz Pro. Many agencies prefer its competitive intelligence for PPC and display, using it to see which keywords competitors like Zillow or Grammarly are bidding on and what ad copy they test.
Compared with dashboard-focused tools like DashThis or AgencyAnalytics, it offers deeper research but a denser interface. Keywordly typically pairs it with a visualization layer when CMOs want at-a-glance views while strategists stay inside Semrush for granular analysis.
Reference: Semrush: Your Unfair Advantage for Growing Brand Visibility
Ahrefs
Ahrefs is widely used by SEOs who need reliable backlink data, rank tracking, and technical insights in one place. For agencies using Keywordly or similar workflows, it often acts as the data engine that powers more visual reporting tools.
In comparisons like 6 Best SEO Reporting Tools for Agencies in 2025, it’s frequently highlighted not as a dashboard tool, but as a trusted source of SEO metrics that you plug into client-facing reports.
Overview
Ahrefs provides backlink analysis, keyword research, and competitor intelligence that help you decide where to focus content and link-building. Its crawler is often cited as one of the most active after Google’s, which is why link indices for domains like HubSpot or Shopify tend to look very complete.
Agencies typically use it to monitor rankings, run content gap studies, and track how technical fixes affect visibility, then export that data into BI tools or platforms such as Whatagraph or Looker Studio for presentation.
Technical Requirements
Because it’s a browser-based SaaS, your team just needs a modern browser and stable internet connection—no desktop installation or server setup. That makes onboarding simple when you’re scaling an SEO team across multiple locations.
For advanced reporting, API access is only available on higher tiers, so teams often combine CSV exports with Google Sheets or BigQuery before piping numbers into dashboards, which requires basic spreadsheet or BI knowledge.
Competitive Positioning
Among specialist SEO platforms, Ahrefs is often compared to Semrush and Moz Pro. Its focus is narrower than a multi-channel suite, prioritizing link data, keyword intelligence, and site auditing over paid media or social analytics.
Agencies that need automated multi-channel client reporting usually pair Ahrefs with tools covered in the best SEO reporting tools for agencies rundown, while relying on Ahrefs as the underlying source of organic search insights.
Reference: Ahrefs—AI Marketing Platform Powered by Big Data
Google Looker Studio
Overview
Google Looker Studio is a free, browser-based reporting platform that lets teams turn raw marketing and analytics data into interactive dashboards. For SEO specialists at Keywordly or in-house teams, it becomes a single, visual layer on top of scattered data sources.
Many agencies use it to merge GA4 engagement metrics with Google Search Console queries and Google Ads spend. For example, a New York agency might track branded vs. non‑branded organic clicks alongside ROAS for key campaigns in one client-facing report.
Technical Requirements
The tool works in Chrome, Edge, Safari, and other modern browsers, and access is tied to a standard Google account. That makes it easy for U.S.-based teams to share dashboards with clients using existing Gmail or Google Workspace identities.
Marketers often start with GA4 and Search Console connectors, then add Supermetrics or Funnel.io to pull in data from Meta Ads, LinkedIn Ads, or HubSpot. A basic grasp of dimensions, metrics, and joins is helpful when blending SEO data with CRM or revenue numbers.
Competitive Positioning
Compared with paid BI tools like Tableau or Power BI, Looker Studio stands out for being free and tightly integrated with Google’s stack. Agencies that already rely on GA4, Google Ads, and BigQuery can deploy client dashboards without new software licenses.
Unlike full SEO platforms such as Semrush or Ahrefs, it does not crawl websites or collect keyword data itself. Instead, it visualizes exports from those tools, letting Keywordly-style teams design executive summaries that compare rankings, traffic, and revenue on one page.
Getting Started
Most teams begin by logging in with a Google account and choosing a template, such as Google’s “GA4 – Ecommerce” starter report. This speeds up setup while offering a structure that can be customized for each client or business unit.
From there, marketers connect GA4, Search Console, and a Google Sheet that might contain monthly target keywords or revenue goals. Using drag‑and‑drop charts, they build SEO performance overviews and schedule weekly PDF emails to CMOs or founders who want quick, visual summaries.
Key Features
Looker Studio offers a mix of interactive controls and deep integration with Google data sources that suits performance-focused teams.
Features
- Interactive dashboards with filters, date selectors, and drill‑down by device, landing page, or campaign
- Native connections to GA4, Search Console, Google Ads, and BigQuery for streamlined setup
- Custom calculated fields and cross‑source data blending for advanced attribution or funnel reporting
- Near real‑time updates driven by the underlying connected platform’s refresh schedule
- Simple sharing via links, website embeds, and scheduled PDF delivery for stakeholders
Pros
For SEO agencies and content teams, the platform delivers strong value without recurring license fees. That makes it attractive for smaller U.S. businesses that still need polished reporting.
Pros
- Free access with powerful visualization options tailored to marketing and analytics data
- Highly customizable layouts and controls for both executive summaries and analyst‑level views
- Deep, native integration with GA4, Google Ads, and Search Console data sets
- Supports cross‑channel reporting when paired with connectors or cloud data warehouses
Cons
There are trade‑offs: non‑Google platforms usually require paid connectors, and more complex dashboards can strain performance. Teams scaling from a handful of charts to dozens may notice slower load times.
Cons
- Relies on external connectors for platforms like Meta Ads, often adding extra monthly cost
- Learning curve for marketers unfamiliar with joins, calculated fields, or schema design
- Large multi-page reports with many blend operations can load slowly or time out
- Lacks native SEO widgets such as backlink explorers or technical audit summaries
Pricing
Access to the core platform is free for anyone with a Google account, which is a key reason agencies adopt it for reporting. The main expenses typically arise from the data pipelines feeding dashboards.
For instance, a 15‑client agency might spend a few hundred dollars per month on Supermetrics plus BigQuery storage to centralize ads and CRM data. Even with these add‑ons, total reporting costs often stay lower than licenses for enterprise BI tools.
User Sentiment
Practitioners often praise the flexibility and integration with GA4 and Search Console, especially when replacing static Excel or PowerPoint reports. Many SEO leaders highlight how stakeholders engage more when they can filter by device or region on their own.
Common complaints include a steeper learning curve for advanced blending and occasional slowness on heavy reports. Still, for agencies like Keywordly focused on transparent, data-rich SEO reporting, the balance of cost and capability is typically viewed as favorable.
Reference: Looker Studio Overview – Google
AgencyAnalytics
Overview
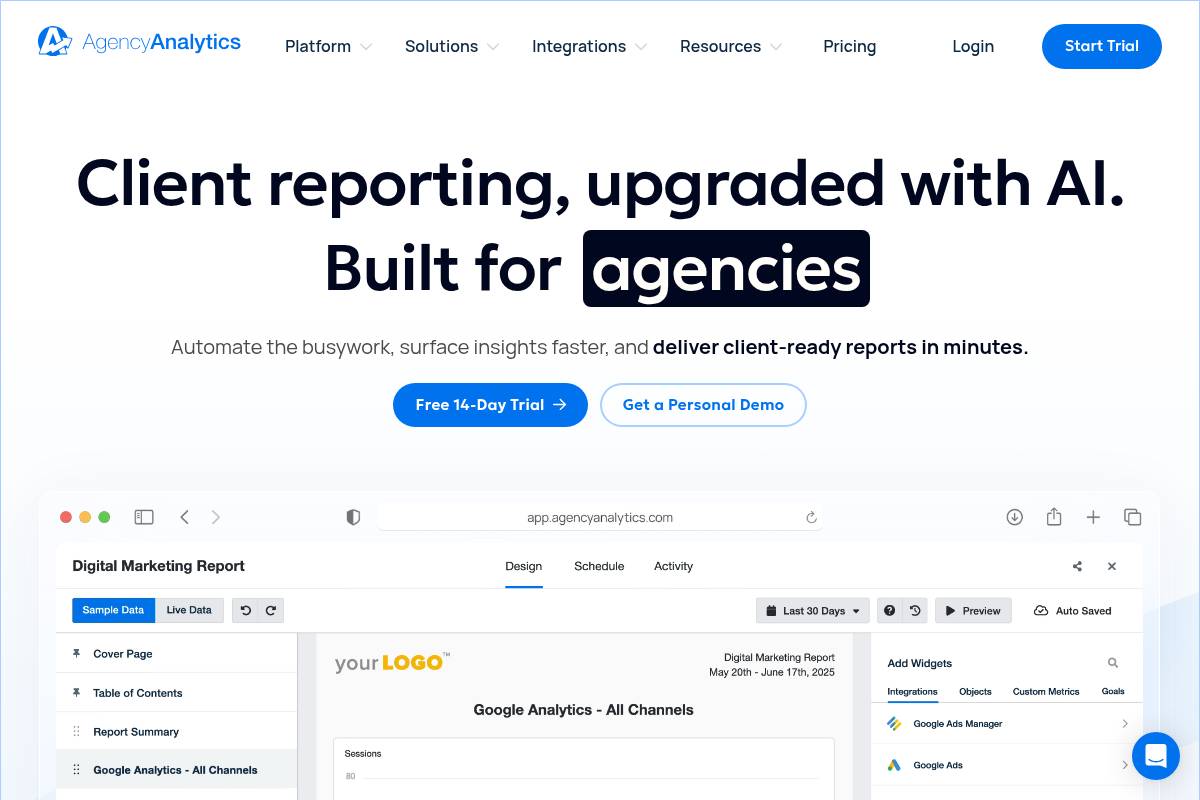
AgencyAnalytics is purpose-built for digital agencies that need to deliver consistent, visual performance reports across dozens of clients. Instead of pulling screenshots from GA4, Search Console, and Google Ads into slides, teams can centralize KPIs and present them in a polished, branded interface.
For example, a mid-size agency managing 40 local SEO clients can spin up templated dashboards for rankings, calls, and conversions, then schedule monthly PDFs for stakeholders who prefer email. Account managers still have live dashboards for ad‑hoc questions between reporting cycles.
Technical Requirements
Because AgencyAnalytics runs in the browser, most teams only need a modern Chrome or Edge setup and reliable broadband. The platform connects directly to data sources like GA4, Search Console, Google Ads, Facebook Ads, and LinkedIn Ads through secure OAuth authentication.
Agencies typically request admin or standard access to each client’s properties to sync data. For instance, a Keywordly strategist might map a client’s GA4, CallRail account, and Ahrefs integration into one dashboard, ensuring daily refreshes without manual CSV uploads.
Competitive Positioning
This platform is framed as an agency-first reporting hub rather than a full SEO suite or general BI product. It prioritizes multi-client management, white-label portals, and cross-channel visualization over advanced keyword research or complex modeling.
Compared with tools like Looker Studio or Power BI, setup is faster because marketers can start from ready-made templates and marketing-specific integrations. Against suites such as Semrush or Ahrefs, AgencyAnalytics typically wins on reporting automation at scale, not on deep competitive research.
Reference: AgencyAnalytics: Automated Client Reporting for Marketing …
DashThis
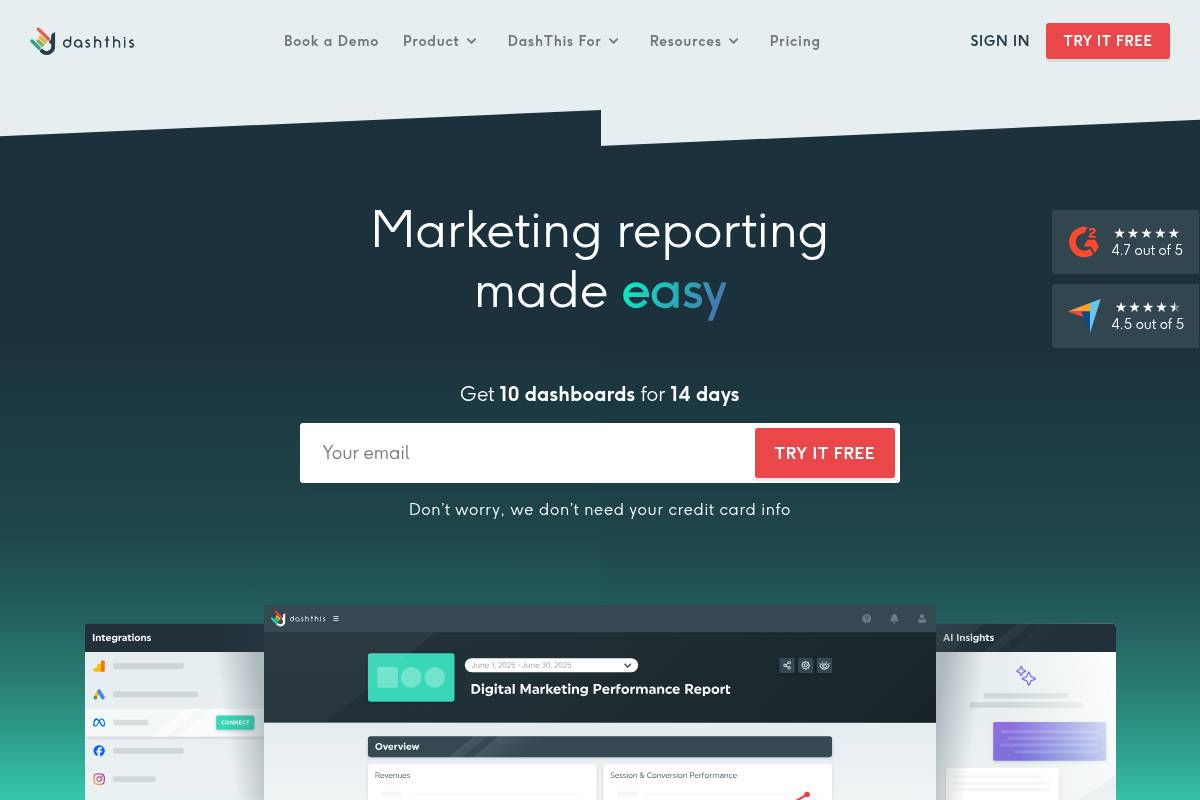
Overview
DashThis is a lightweight marketing reporting platform designed for agencies and in‑house teams that need clear, visual performance snapshots without a heavy BI setup. It pulls metrics from sources like Google Analytics 4, Google Ads, Meta Ads, and LinkedIn into client‑ready dashboards.
Keywordly clients often use DashThis to replace manual Google Sheets reports for monthly SEO and PPC reviews. For example, an agency handling 20 local HVAC businesses can plug in each client’s GA4 and Google Business Profile data to generate side‑by‑side traffic and lead summaries in minutes.
Technical Requirements
Because DashThis is fully cloud‑based, you only need a modern browser such as Chrome or Edge and a stable internet connection. Reports update automatically, so there’s no need to install desktop software or worry about version control across your team.
Marketers connect platforms like GA4, Search Console, and Facebook Ads through native connectors. A content strategist at a Shopify brand, for instance, can build a dashboard that blends organic sessions, product revenue, and email sign‑ups without writing SQL or using a data warehouse.
Competitive Positioning
Compared with tools like Looker Studio or Power BI, DashThis focuses on speed and simplicity rather than advanced modeling. It works well when you want to communicate results, not engineer complex data pipelines or custom schemas.
Agency platforms such as AgencyAnalytics or ReportGarden often bundle project management or call tracking. DashThis instead optimizes for quick, clean reporting. A small SEO agency with two analysts and 30 clients can build standardized monthly decks in DashThis, then manage tasks separately in Asana or ClickUp.
Getting Started
Onboarding typically begins by creating an account, then connecting your primary data sources like GA4, Search Console, and Google Ads. This initial setup often takes less than an hour for a standard client, assuming proper admin permissions are in place.
Once sources are linked, you can choose templates or assemble dashboards from widgets showing KPIs such as organic sessions, non‑brand clicks, and ROAS. Many Keywordly users schedule automated PDF or URL reports for the first business day of each month, so account managers can focus on commentary instead of exporting charts.
Key Features
DashThis includes a focused feature set built for marketing teams, emphasizing automation and clarity in reporting.
Features
- Prebuilt SEO, PPC, social, and multi‑channel templates tailored for client‑facing reporting
- Automated sync with platforms like GA4, Search Console, Google Ads, Facebook, and Instagram
- Drag‑and‑drop widgets for time‑series graphs, tables, and KPI tiles
- White‑label branding with custom logos, colors, and domain options
- Multi‑client management to organize dozens of dashboards in one interface
Pros
For many agencies, the primary advantage is time saved on recurring updates. Reports that once took hours of spreadsheet work can be refreshed automatically, freeing strategists to focus on analysis.
Pros
- Fast to implement and intuitive for non‑technical marketers
- Client‑friendly visuals that clarify trends in traffic, conversions, and ad spend
- Specialized support resources for agencies, including templates and onboarding calls
- Significant reduction in manual reporting for weekly or monthly performance reviews
Cons
DashThis does have trade‑offs, especially for teams that expect deep customization or advanced data modeling. It is more a reporting layer than a full analytics stack.
Cons
- Limited complex calculated fields and custom data transformations compared with BI suites
- Challenging to integrate unusual or proprietary data sources without supported connectors
- Less granular SEO diagnostics than tools such as Semrush or Ahrefs
- Pricing can rise as you add dashboards for dozens of smaller clients
Pricing
DashThis prices plans based on dashboard volume and collaboration features. Smaller agencies might start with a handful of boards covering SEO, paid search, and social for their top clients, then scale as their book of business grows.
Higher tiers generally unlock extra dashboards, user seats, and advanced white‑label options like custom domains. A free trial is typically available, so a team can prototype a few Keywordly performance reports before committing; the exact dollar amounts change, so it’s wise to confirm current details on the official pricing page.
User Sentiment
Marketing teams often praise DashThis for shortening the gap between data and client‑ready storytelling. Reviews on sites like G2 commonly mention being able to roll out unified reporting across 10–50 clients within a single quarter.
Power users who need multi‑touch attribution or warehouse‑level modeling sometimes feel boxed in by its simplified structure. For most SEO and content programs focused on transparent, recurring updates, though, DashThis tends to strike a practical balance between control and convenience.
Reference: DashThis
Databox
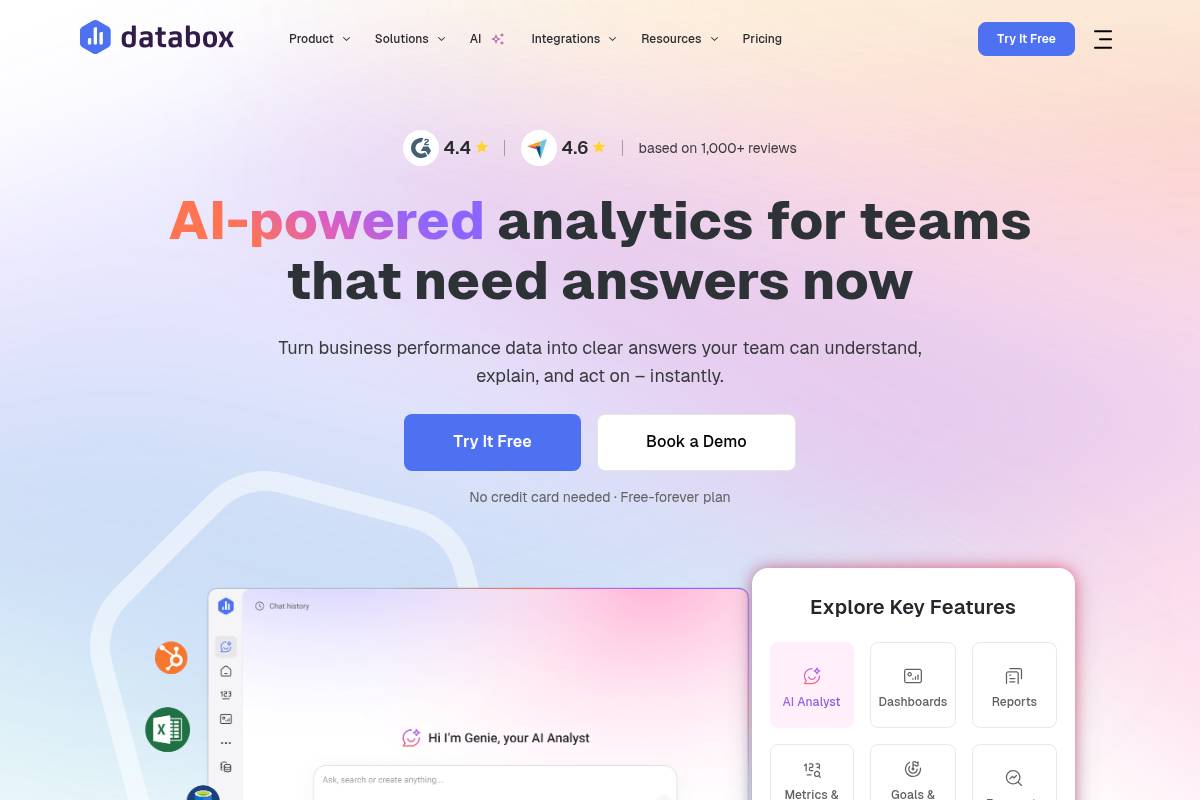
Overview
Databox helps marketing, sales, and product teams pull KPIs from dozens of tools into a single, visual performance hub. Instead of jumping between GA4, Search Console, HubSpot, and ad platforms, teams see traffic, leads, and revenue trends side by side.
Agencies often use Databox to pair SEO metrics with pipeline data. For example, a B2B agency might track organic sessions and keyword rankings from Google alongside HubSpot MQLs and Salesforce opportunities to report how content efforts influence closed-won deals.
Technical Requirements
Because Databox is cloud-based, most teams only need a modern browser and the mobile app for on-the-go access. Connections are made via native integrations, APIs, or Google Sheets, so your analytics, CRM, and ad platforms can feed live data into one interface.
More advanced setups, such as mapping GA4 events to custom revenue KPIs, require comfort with data structures. For instance, an eCommerce brand might build custom metrics that blend Shopify revenue with SEO landing-page performance to isolate organic-assisted revenue.
Competitive Positioning
Databox is positioned as a cross-channel performance dashboard rather than a pure SEO crawler or rank tracker. Compared with tools like Semrush or Ahrefs, it sacrifices deep backlink and technical crawl data in favor of executive-ready KPI visualizations.
Against lighter BI dashboards such as Google Looker Studio, Databox leans on guided setup, prebuilt templates, and faster time to value. Agencies often adopt it when spreadsheets and static PDFs no longer scale but a full BI stack like Power BI or Tableau is excessive.
Reference: Databox: Business Intelligence & Analytics Software
Raven Tools
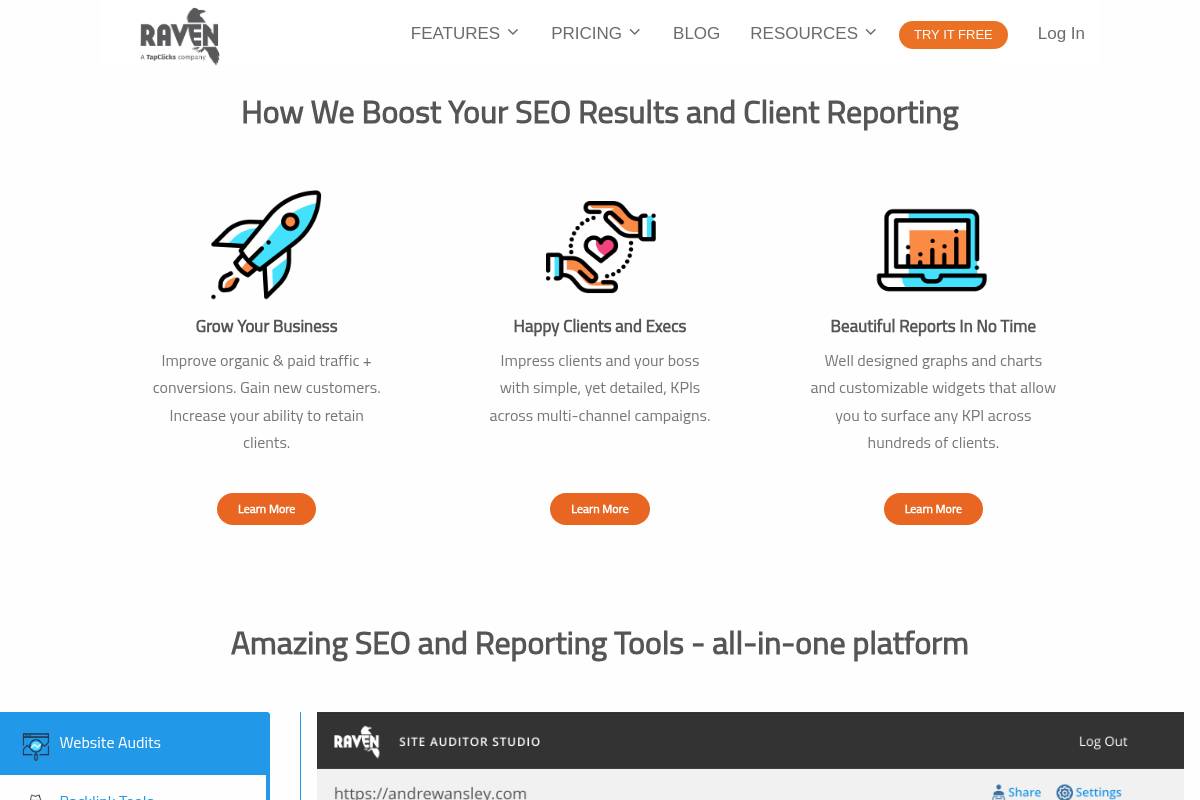
Overview
Raven Tools is a reporting-focused marketing platform that lets teams pull SEO, PPC, social, and analytics data into one dashboard. Instead of bouncing between separate tools, agencies can check technical health, rankings, and campaign performance from a single interface and export client-ready reports.
For example, a boutique agency managing five HVAC clients across Google Ads, Facebook Ads, and organic search can centralize KPIs like conversions, phone calls, and organic traffic into a recurring monthly PDF, cutting manual spreadsheet work by several hours per account.
Technical Requirements
This web-based SaaS product runs in the browser, so most users only need a stable internet connection and a modern browser like Chrome or Edge. Because it connects to analytics and advertising APIs, account permissions are crucial to avoid gaps or errors in reporting.
Teams should connect GA4, Google Search Console, and ad accounts such as Google Ads and Meta Ads Manager. A basic grasp of concepts like impressions, CTR, and conversions helps users interpret charts correctly and explain trends to stakeholders during review meetings.
Competitive Positioning
Raven sits between pure SEO suites and general-purpose dashboard tools. Compared with platforms focused solely on keyword research or backlinks, it emphasizes scheduled, client-facing reports that combine multiple channels in one view.
Against broader BI tools like Looker Studio or Power BI, it offers ready-made marketing templates and SEO-specific widgets. This balance appeals to agencies that want structure and speed rather than maintaining complex, custom data models for every client.
Getting Started
New users typically begin by creating an account and adding each brand or client as a separate profile. From there, they connect GA4, Search Console, and ad platforms so the system can start pulling performance data automatically.
After integrations are live, teams usually run an initial site audit and set up rank tracking for priority keywords. They then customize a reporting template—for instance, a monthly local SEO report—and schedule email delivery to clients or internal stakeholders.
Key Features
Raven includes a mix of diagnostic tools and reporting utilities designed for recurring marketing updates. This combination helps agencies reduce their tool stack while still delivering detailed insights into technical health and campaign outcomes.
- Site audits, rank tracking, and backlink data for on-page and off-page analysis
- Customizable, automated and white-labeled client reports
- Integrations covering analytics, paid search, and social channels
- Prebuilt reporting templates for SEO, technical performance, and KPIs
- Link management workflows to support outreach and authority-building
Pros
Agencies and in-house teams often choose this platform to simplify reporting and centralize SEO diagnostics. Its structure supports consistent delivery of insights without heavy manual updates month after month.
- Combines optimization tools and reporting in one login
- White-label options and multi-client management for agencies
- Reduces reliance on separate audit, rank, and reporting solutions
- Produces repeatable audit and ranking snapshots for trend analysis
Cons
Despite its strengths, there are trade-offs compared with both high-end SEO suites and modern BI products. Some users mention the interface and certain databases feel less current than newer competitors.
- Interface can feel dated compared with newer cloud tools
- Data coverage may trail leading keyword and link databases
- Reporting customization is less flexible than full BI platforms
- Pricing must be weighed against all-in-one or niche dashboard options
Pricing
Plans are structured around the number of domains, users, and report allowances. Higher tiers typically raise limits and expand white-labeling, which can be critical for agencies scaling from a handful of retainers to dozens.
A trial period is usually available, giving teams time to import accounts, test audits, and build sample reports before committing. Because pricing changes periodically, it is best practice to confirm current tiers directly on the Raven Tools website.
User Sentiment
User reviews often highlight the blend of SEO capabilities with cross-channel reporting. Agencies appreciate managing multiple brands from one login and exporting consistent, branded reports for client calls.
Some practitioners, especially those used to tools like Ahrefs or Semrush, note that data depth and UI design could be more modern. Still, they often keep Raven for its dependable, automated reporting workflow that reduces manual effort for recurring updates.
Reference: Raven Tools – White Label SEO Reports and SEO Tools
SE Ranking
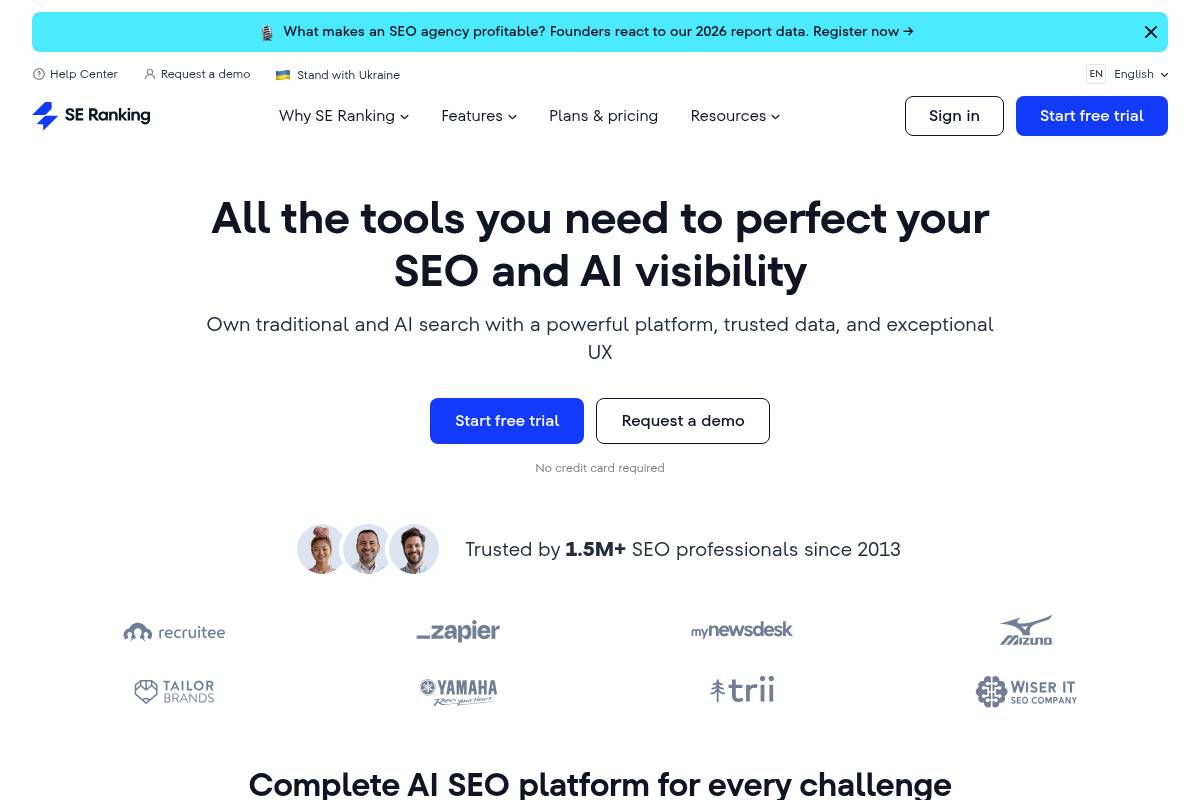
Overview
SE Ranking is an all-in-one search engine optimization suite designed to centralize rank tracking, site audits, keyword research, and competitor insights in a single dashboard. For teams at Keywordly working with multiple client sites, it helps replace scattered spreadsheets and manual checks with structured, comparable data.
Agencies like Siege Media and small in-house teams often use similar cloud SEO platforms to standardize reporting. SE Ranking’s automated reporting lets account managers send monthly performance summaries to stakeholders, blending visibility data, traffic trends, and technical health without rebuilding slides for every update.
Technical Requirements
This platform runs fully in the browser, so most users only need a modern version of Chrome or Firefox and a stable connection. Projects, keywords, and crawl settings are configured inside the web app, which makes it practical for distributed teams or remote agencies.
Connecting GA4 and Google Search Console allows SE Ranking to blend ranking, click, and conversion metrics into consistent reports. SEO specialists should understand concepts like crawl budget, meta data, and canonicalization to interpret audit results and fine-tune settings for large catalogs or multi-language sites.
Competitive Positioning
Compared with bigger platforms such as Semrush and Ahrefs, SE Ranking positions itself as a budget-conscious option that still covers core workflows. This matters for boutique agencies and freelancers who cannot justify several hundred dollars per month per seat but still need dependable rank tracking and audits.
The suite offers integrated reporting, though it is less customizable than BI tools like Looker Studio or Power BI. Teams that primarily need recurring SEO performance summaries typically find the native dashboards sufficient, while data-heavy organizations may export metrics into external visualization stacks.
Getting Started
Onboarding is simple: sign up, create a project, and add your primary domain along with a curated keyword set mapped to core pages. Many agencies start by importing terms from Search Console and refining them by search intent before scheduling daily or weekly rank checks.
After linking GA4 and Search Console, configure automated reports using templates tailored to executives or channel managers. For example, a weekly email might focus on top 50 keywords, visibility changes, and critical technical issues, while a monthly report highlights traffic, conversions, and competitor movement for leadership.
Key Features
SE Ranking brings several core optimization capabilities into one interface. For Keywordly and similar teams, this reduces the need to juggle multiple subscriptions and logins while managing high volumes of client campaigns.
- Accurate rank tracking across locations, devices, and search engines
- Site audit for detecting technical SEO issues and optimization opportunities
- Backlink monitoring and competitor analysis tools
- Keyword research, clustering, and on-page SEO checks
- Automated report generation with options for branding and customization
Localized rank tracking is especially useful for businesses like multi-location clinics or regional eCommerce brands, where visibility in specific cities drives revenue. Keyword clustering helps content teams structure topic hubs and avoid cannibalization across similar landing pages.
Pros
For many agencies and consultants, the main attraction is the balance between coverage and price point. The platform includes the critical capabilities needed to launch, monitor, and refine campaigns for small and mid-sized businesses.
- Strong value for money, especially for smaller teams and solo SEOs
- Comprehensive set of core SEO tools in a single platform
- Automated reporting simplifies recurring client or stakeholder updates
- User-friendly interface with helpful tutorials and documentation
New staff at Keywordly can typically become productive with SE Ranking after a short orientation. Built-in guides and tooltips lower the learning curve compared with more complex enterprise stacks that demand significant onboarding time.
Cons
There are trade-offs compared with premium enterprise ecosystems. Power users sometimes encounter limits when they require extremely deep index data, extensive APIs, or highly custom reporting outside the standard templates.
- Data coverage may be narrower in some markets compared with the largest SEO suites
- Advanced users might find limits in highly specialized or enterprise-level features
- Reporting customization may not match the flexibility of dedicated BI or dashboard tools
- White-label and agency-specific features may require higher-tier plans
For teams that rely heavily on data science workflows or complex multi-touch attribution models, SE Ranking usually acts as one of several data sources rather than a single source of truth.
Pricing
SE Ranking uses tiered plans based on the number of keywords, projects, and update frequency. While specific figures change, published prices are generally lower than comparable tiers from larger players, which appeals to agencies managing clients with limited budgets.
Annual billing typically includes discounts, and higher volumes often unlock more favorable terms. Because inclusions vary by plan, Keywordly’s ops teams should review the pricing page carefully to align rank-check frequency and project limits with forecasted client growth.
User Sentiment
Reviews on platforms like G2 and Capterra often emphasize strong value and dependable tracking accuracy for the price. Many small businesses and consultants mention that the interface feels intuitive even for marketers who are not full-time technical SEOs.
Some advanced practitioners note that link data and specialized features can lag behind bigger competitors, so they sometimes pair SE Ranking with targeted tools such as Majestic or Screaming Frog. For typical agency workloads, however, the platform’s capabilities are usually sufficient to plan and report on ongoing optimization programs.
Reference: SE Ranking — AI SEO Software That Gets Results
Moz Pro
Overview
Moz Pro is a long-standing SEO platform that helps teams manage keyword research, ranking performance, and site health from a single dashboard. For Keywordly clients, it often serves as a central hub to understand how technical fixes and content updates translate into visibility gains over time.
The suite combines rank tracking, link analysis, and crawl diagnostics with visual reporting. For example, an in-house team at Zillow has cited Moz metrics like Domain Authority when benchmarking content sections against Realtor.com and Redfin to prioritize new link-building initiatives.
Technical Requirements
Because Moz Pro is fully cloud-based, your team only needs a modern browser like Chrome or Edge and stable internet access. Most agencies run it alongside tools such as Google Analytics and Google Search Console, keeping all windows open during weekly optimization reviews.
Linking Moz with Google Analytics lets you correlate organic traffic with ranking changes at the campaign level. Teams at mid-size B2B firms often create views by region or product line so they can see whether a 20% lift in rankings for a term like “SaaS onboarding software” is actually driving qualified sessions and leads.
Reference: Moz Pro: All-in-One SEO Toolkit
Supermetrics
Overview
Supermetrics is a connector layer that moves marketing and SEO data into destinations like Google Sheets, Looker Studio, Excel, and cloud warehouses. For Keywordly clients, this often becomes the backbone of performance reporting, feeding unified data into whichever BI or spreadsheet tools teams already trust.
Instead of downloading CSV files from Google Analytics 4, Google Search Console, and Meta Ads, teams configure scheduled pulls. An agency handling 20 clients, for example, can centralize clicks, conversions, and ROAS in one Looker Studio dashboard while still modeling data at the sheet or warehouse level.
Technical Requirements
Running Supermetrics typically involves installing an add-on or connector inside Google Sheets, Excel, Looker Studio, or a data warehouse like BigQuery or Snowflake. Once installed, you authenticate each data source, which means you need admin or at least reporting access to platforms such as GA4, Search Console, and ad accounts.
To fully benefit, teams should be comfortable with spreadsheet formulas or BI concepts like joins and calculated fields. For instance, a Keywordly strategist might join Search Console queries with GA4 landing page data in BigQuery to evaluate which blog posts actually drive assisted conversions rather than just impressions.
Competitive Positioning
Supermetrics focuses on data integration rather than native visualization, positioning it differently from tools like AgencyAnalytics or Whatagraph that ship with prebuilt dashboards. It acts as a flexible pipe, letting you keep Tableau, Power BI, or Looker Studio as your presentation layer.
Compared with broader ETL tools such as Fivetran or Stitch, Supermetrics leans heavily into marketing and advertising connectors. Agencies running large Google Ads and Facebook Ads budgets often pick it because the marketing schemas, prebuilt fields, and template queries are tailored to performance reporting rather than generic data engineering.
Getting Started
To get started, choose your destination first. Many Keywordly partners begin with Google Sheets or Looker Studio, then graduate to BigQuery once data volumes and retention needs grow. Install the corresponding Supermetrics connector or marketplace add-on, then open its sidebar or configuration panel.
From there, authorize sources like GA4, Search Console, and LinkedIn Ads. Configure queries by selecting metrics, dimensions, and date ranges, then schedule refreshes daily or hourly. A common setup pulls daily GA4 conversions, Search Console clicks, and Google Ads spend into BigQuery, where a Looker Studio dashboard visualizes blended cost-per-acquisition across channels.
Key Features
Supermetrics offers a broad feature set aimed at digital marketing and analytics teams that want control over their data layer while using existing BI tools.
- Dozens of marketing and analytics connectors, including GA4, Search Console, Meta Ads, LinkedIn Ads, HubSpot, and Shopify.
- Automated, scheduled refreshes into spreadsheets, dashboards, and data warehouses such as BigQuery and Snowflake.
- Custom query builder to define metrics, dimensions, filters, and time frames for each data pull.
- Support for high-volume data and historical backfills in warehouse destinations.
- Tight integration with common BI stacks so teams can build tailored SEO and paid media reporting.
Pros
For SEO and performance teams at Keywordly and similar agencies, Supermetrics delivers clear benefits when reporting across multiple channels and clients.
- Centralizes search, paid, and analytics data in tools your analysts already know, such as Sheets or Power BI.
- Eliminates repetitive exports from GA4 and Search Console, saving hours per month per analyst.
- Highly adaptable for custom funnels, attribution models, and multi-touch reporting when combined with a BI layer.
- Large connector catalog covers nearly all major media platforms, from Google Ads to TikTok Ads and Twitter Ads.
Cons
Despite its strengths, Supermetrics is not always the best fit for teams that need quick, templated dashboards without technical setup.
- Provides data pipes, not native dashboards, so you must still design reports in Looker Studio, Tableau, or similar tools.
- Requires spreadsheet or BI literacy to handle joins, calculated fields, and data modeling.
- Subscription costs can climb when you add many connectors, destinations, or larger row limits.
- Ongoing maintenance, such as updating schemas when platforms change APIs, can feel more technical than plug-and-play tools.
Pricing
Supermetrics pricing depends on destination type, number of data sources, and usage caps. Spreadsheet plans are usually cheaper, while warehouse or API-based products cost more but support larger volumes and more robust automation.
Most plans are subscription-based, billed monthly or annually, with higher tiers allowing additional connectors and greater row limits. Trials or guided demos are commonly available, which Keywordly often recommends before committing so teams can validate that required connectors and fields are supported for their reporting needs.
User Sentiment
Among power users in agencies and in-house growth teams, Supermetrics is regarded as a reliable workhorse for assembling multi-channel marketing datasets. Many practitioners report cutting weekly reporting time from several hours to under 30 minutes once automated pulls are configured.
Some feedback notes that the learning curve and cumulative pricing can be challenging for smaller businesses. That said, for organizations managing multiple brands or large ad budgets, the ability to standardize data flows into a central BI environment typically outweighs those concerns, especially when analysts already live in Google Sheets and Looker Studio.
Reference: Supermetrics: Marketing Intelligence Platform
Recommendations
Choosing the right reporting stack depends on your team’s size, technical comfort, and how often you need to share insights. Keywordly recommends starting with the lightest toolset that reliably covers your SEO and reporting needs, then layering complexity only when data demands grow.
Below are practical combinations based on common scenarios our clients face, from solo consultants to enterprise marketing teams connecting multiple channels.
Best for Solo SEO Beginners and Small Businesses
Freelancers and small local brands usually need straightforward rank tracking, basic site audits, and simple monthly reports. SE Ranking and Moz Pro pair well with Looker Studio to achieve this without breaking the budget.
For example, a local dentist in Austin can track 50–200 keywords in SE Ranking, run weekly audits, then push Google Search Console and Analytics data into Looker Studio for a one-page performance dashboard.
Best for Agencies Needing White-Label, Automated Client Reporting
Agencies juggling 20+ retainers must automate recurring reports and present them under their own brand. AgencyAnalytics and DashThis both offer white-label portals, cross-channel widgets, and scheduled PDF email reports.
A mid-size agency serving eCommerce clients might pull Semrush Position Tracking and Site Audit data into AgencyAnalytics, then automate branded monthly reports for 40 clients, saving dozens of hours of manual exports.
Best for Enterprises with Complex Data Stacks and Multi-Channel Analytics
Large organizations often centralize data in BigQuery, Snowflake, or Redshift. Databox and Looker Studio, connected through Supermetrics or native warehouse connectors, can surface SEO metrics alongside paid media, CRO, and revenue data.
An enterprise retailer could blend Ahrefs backlink data, SE Ranking keyword trends, and Salesforce revenue figures inside Looker Studio, giving leadership a single, governed view of performance across thousands of SKUs.
Best for Content Marketing Teams
Editorial and content strategy teams need to connect topics and formats to traffic, engagement, and assisted conversions. Semrush and Ahrefs shine here by mapping keywords, SERP features, and content gaps against live performance.
A B2B SaaS blog team might use Semrush’s Topic Research and Organic Research, then visualize page groups by funnel stage in Looker Studio to see that comparison guides drive 30% more demo requests than generic thought-leadership posts.
Best for Teams Already Using BI Tools and Needing Strong Data Connectors
Marketing groups embedded in data-driven companies often rely on Power BI, Tableau, or Looker (Google Cloud) as their single source of truth. In these cases, the priority is robust data pipelines rather than new dashboards.
Supermetrics can stream Search Console, Google Ads, and Semrush data into BigQuery, after which analysts build custom models in Tableau. One multi-brand publisher used this stack to track millions of URLs and reduced manual reporting time by over 60%.
FAQs
1. How do automated reporting tools help with SEO?
Automated reporting platforms reduce manual spreadsheet work and let teams focus on analysis. They pull metrics from multiple sources into one view so SEOs can react faster to changes in traffic or rankings.
For example, Keywordly can auto-generate a weekly report that flags drops in branded clicks or Core Web Vitals issues. Agencies using tools like Looker Studio with connectors often save 5–10 hours per month per client on reporting alone.
2. What data sources should my SEO reporting software integrate with?
Effective reporting relies on combining search, analytics, and revenue data. Most teams start with Google Analytics 4 and Google Search Console, then layer in keyword and backlink platforms.
Advanced setups connect systems like HubSpot or Salesforce so you can see which landing pages from organic search contribute to pipeline. Some Keywordly users also integrate Semrush or Ahrefs to overlay visibility metrics on top of lead and revenue reports.
3. How often should automated SEO reports be sent?
Cadence depends on audience and site scale. Executives typically prefer clean monthly summaries with trendlines and key insights rather than daily fluctuations that create noise.
Hands-on SEO teams often rely on weekly or biweekly reports to monitor tests, such as structured data changes or new content clusters. Large publishers may keep internal daily dashboards for anomalies, only sharing curated readouts with leadership less often.
4. What’s the difference between SEO reporting software and content optimization tools?
Reporting platforms track performance metrics such as traffic, rankings, and technical errors. They answer questions like whether a new section increased organic sessions or if a site migration affected crawl behavior.
Content optimization tools, such as Clearscope or Surfer, focus on improving on-page relevance and structure against search results. Many Keywordly clients pair both: optimization software to refine articles, and dashboards to prove lifts in clicks and conversions.
5. How can a business justify the cost of digital marketing analytics tools?
To defend budgets, translate saved time and better decisions into dollars. If an SEO manager spends 8 hours a month on manual reports at $70 per hour, automation saving 75% of that time equals over $5,000 a year.
Clearer attribution often reveals content that drives outsized revenue. One SaaS company reported via GA4 and Salesforce that a single organic comparison page generated over $250,000 in annual pipeline, easily covering their reporting stack and content investment.